I remember early in my coaching career assuming that "minutes played" was the simplest, most honest measure of workload. If a back rower spent 60 minutes on the pitch and a prop 30, the math seemed obvious: more minutes = more load = greater risk and greater need for recovery. Years of working with teams, poring over GPS files and watching players limp off after 10 high-impact carries taught me otherwise. In rugby, time is a crude proxy. What really drives fatigue, adaptation and injury risk is the player load — a composite of locomotor, collision and metabolic stress captured by wearable tech and contextualised by coaching judgement.
What I mean by "player load"
When I say player load, I don’t refer to a single number. It’s a lens on the total stress placed on an athlete across multiple domains:
- External load: GPS distances, high-speed metres, accelerations/decelerations, sprint distance, and contact counts.
- Internal load: heart rate responses, session RPE (sRPE), and biomarkers when available.
- Collision load: tackles made and received, ruck involvements, scrums — often tracked via accelerometers and impact sensors.
- Neuromuscular load: peak velocities, change of direction forces, jump metrics from force platforms or inertial sensors.
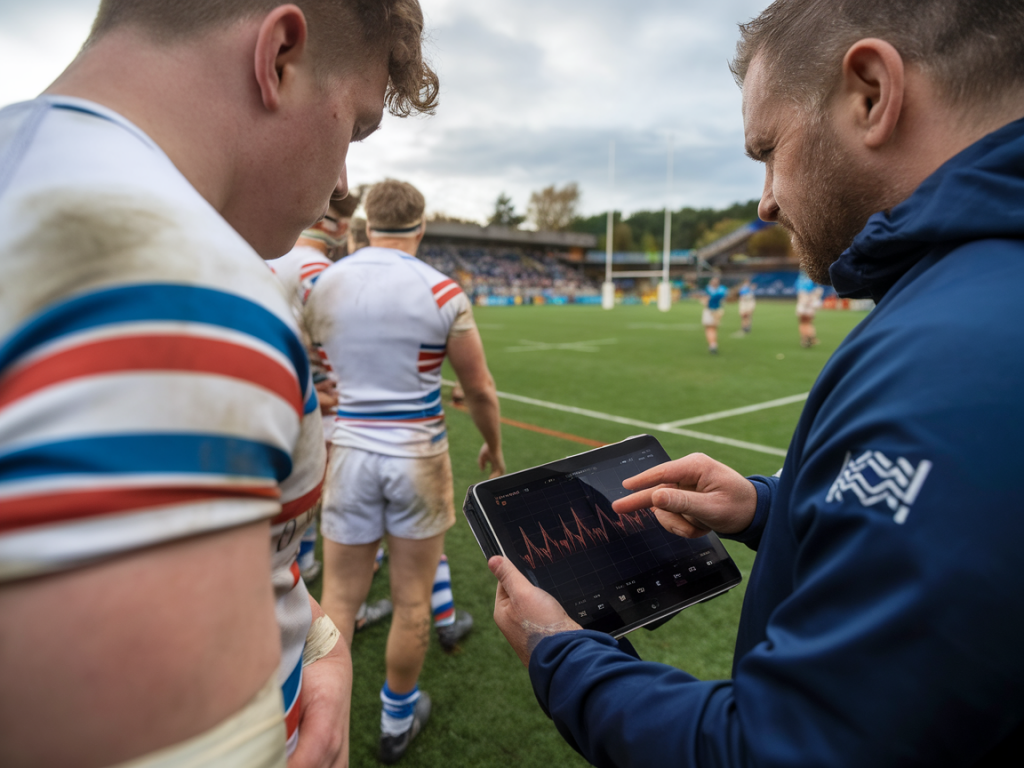
Brands like Catapult, STATSports, Polar and Garmin give us raw streams. Tools such as PlayerLoad™ (a proprietary Catapult metric derived from tri-axial accelerometers) or session-windows combining sRPE with duration turn those streams into actionable load estimates. But raw products don’t replace the need for context — position, individual resilience, match intensity and microcycling matter.
Why minutes can be misleading
Minutes played ignore intensity and contact. Consider two scenarios I’ve seen in the same match:
- A lock plays 80 minutes but the game is dominated by territory and set-piece; his locomotor demands are moderate and contact count low. His recovery profile looks different.
- A flanker plays 50 minutes but is involved in 20 tackles, 12 carries with heavy impacts and several maximal sprints. His neuromuscular and collision load is far greater.
Both players have minutes logged, but their biological stress is incomparable. Using minutes alone can underload, overload or misinterpret training stimulus. The practical consequences are real: poor rotation plans, inadequate recovery prescription and muddled return-to-play progressions.
Key wearable metrics every rugby coach should track
- Total distance — useful baseline but not the whole picture in rugby.
- High-speed running (HSR) & sprint distance — flags maximal efforts that drive neuromuscular fatigue.
- Accelerations/decelerations — repeated changes of speed increase eccentric load and metabolic cost.
- PlayerLoad / tri-axial accelerometer load — integrates multi-directional movement and impacts.
- Contact counts / g-forces — collisions are a large part of match load; thresholds for "high-impact" hits matter.
- sRPE × duration (session-RPE) — an inexpensive internal load metric that correlates well with physiological stress.
- Heart rate & HRV — for cardiovascular strain and recovery monitoring.
How I interpret wearable data — practical rules I use
- Always combine internal and external metrics. A player with moderate GPS load but high sRPE or elevated HRs may be under-recovered or injured.
- Contextualise contacts. Not all collisions are equal — a high g-force tackle followed by involuntary deceleration is more impactful than a controlled ruck clear-out.
- Watch acute:chronic workload ratios (ACWR) cautiously. They’re a helpful flag but not a definitive predictor. Use them alongside monotony, strain and recent injury history.
- Position-specific thresholds. Backs will generally accumulate more HSR; forwards more collisions and PlayerLoad from short, high-intensity movements.
- Individual baselines matter. Build each player's normal range across pre-season to better detect deviations mid-season.
Sample table: minutes vs a simple player-load picture
| Player | Minutes | Total distance | HSR | Contacts (high g) | PlayerLoad |
|---|---|---|---|---|---|
| Lock A | 80 | 6,800 m | 120 m | 6 | 450 |
| Flanker B | 50 | 5,200 m | 420 m | 18 | 680 |
| Wing C | 30 | 3,000 m | 960 m | 2 | 320 |
Looking at minutes, you’d think Lock A did the heaviest work. The PlayerLoad tells a different story: Flanker B incurred a much higher composite load despite fewer minutes.
How this changes coaching decisions
When I design training blocks or select squads, player load shapes several decisions:
- Rotation and substitution planning: I prefer to rotate based on accumulated load and upcoming opponent intensity, not just minutes in the last match.
- Tapering and recovery: A player with high collision load may need extra restorative sessions (soft tissue, light aerobic, sleep hygiene) even if their GPS numbers look low.
- Individualised conditioning: If a player’s HSR is below target for their position, I’ll prescribe targeted sprint exposures during the microcycle while keeping contact load managed.
- Return-to-play progressions: We match not only minutes but the profile of load — contact, sprinting, accelerations — to previous match demands.
Common coach questions and my answers
Q — How many metrics are too many?
A — Start simple. I often begin with PlayerLoad, HSR, contacts and sRPE. Add HR and neuromuscular tests as you scale. Too many metrics without a plan creates noise, not insight.
Q — Are wearables reliable?
A — Modern units from Catapult and STATSports are robust for team use, but understand each system’s limitations: indoor collisions, scrum shuffles and very short acceleration bursts can have signal error. Use multiple streams (video, coaching notes) to validate suspicious spikes.
Q — Can I replace subjective feedback with wearables?
A — Never. sRPE, wellness questionnaires and a conversation with the player are essential. Players may mask symptoms; combining self-report with objective load detects mismatches early.
Q — How do I integrate load data into a simple weekly plan?
A — I run a traffic-light system: Green (within normal range), Amber (elevated but acceptable), Red (high risk — modify training). Assign thresholds per metric using your team’s baseline. When marks go amber/red, adapt session content immediately: fewer collisions, shorter high-speed targets, or a recovery session.
Tools and workflows I use
My typical workflow blends tech and human judgement:
- After each session/match, export GPS and accelerometer summaries (Catapult/STATsports) and calculate sRPE × duration.
- Update weekly rolling averages and ACWR. Flag any metric exceeding ±20–30% of chronic values for review.
- Cross-check flagged players against video (for unusual contacts), wellness scores and reported soreness.
- Communicate with the medical and strength & conditioning staff — adjustments are multidisciplinary.
Interpreting wearable data isn’t a magic bullet, but it is a powerful amplifier of good coaching. It lets us see beyond minutes, prioritise player welfare and design sessions that replicate the real demands of rugby. If you’re starting with wearables, focus on a handful of meaningful metrics, build strong baselines, and never let the numbers override what you observe on the training ground.