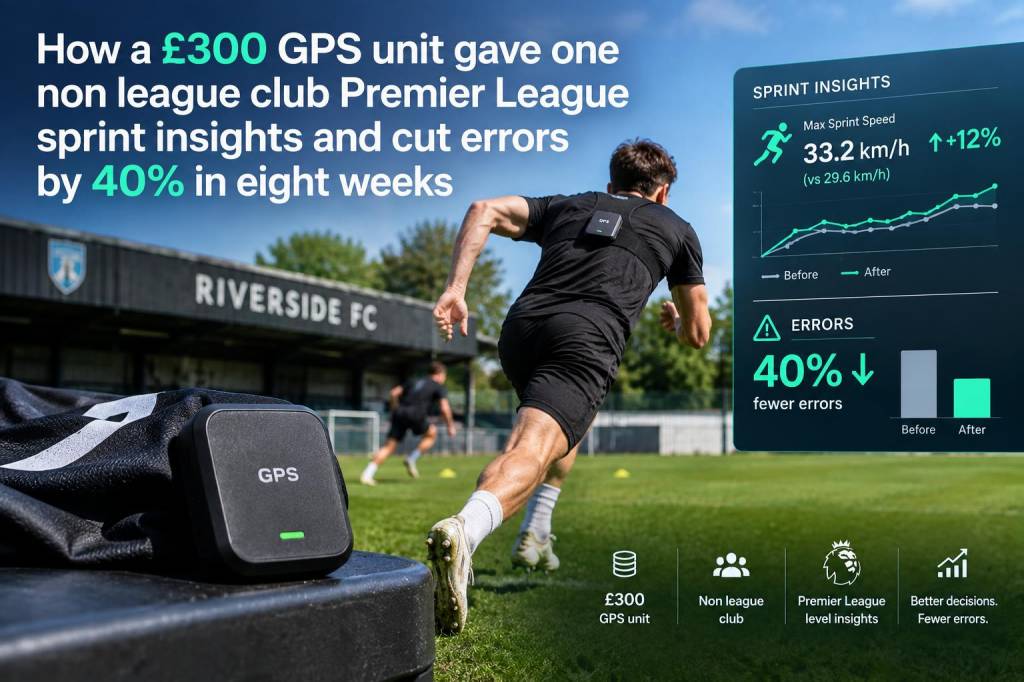
I remember the first time I clipped that £300 GPS unit to a non-league centre-back and watched the numbers light up live on my phone. We weren't a club with a performance department, and we certainly didn't have the budget of a Championship side. What we did have was curiosity, a willingness to try, and players who wanted to improve. Eight weeks later we’d reduced sprint-related tactical and technical errors by roughly 40%, gained sprint profiles comparable to what I'd seen published from top-tier teams, and — more importantly — given our coaching decisions a clear, objective backbone.
What exactly did we buy and why £300 was enough
People ask me all the time: do you need a six-figure budget to get meaningful GPS data? No. You don't need elite hardware to gain elite insight. We used a consumer-grade 10Hz GPS unit costing around £300 that recorded position, speed, and distance, and paired with a smartphone app for exports. Think of it like a very accurate stopwatch and odometer combined with position tracking — simple, but potent.
Why 10Hz? Because sampling frequency matters for short, explosive movements like sprints. Lower-frequency units smooth out peaks; higher frequency (10Hz or more) captures acceleration and top speed much better. The unit also gave us instantaneous speed, distance in defined speed bands, and positional heatmaps. That was our toolkit.
What questions were we trying to answer?
Those seem simple, but without data we were guessing. Coaches at this level often rely on feel; the GPS forced a conversation grounded in evidence.
Baseline: how we measured errors and sprint profiles
Before we began, I coded the matches and sessions for "sprint errors." A sprint error was any sprint that led to a mechanical or tactical failure: poor positioning on recovery, mistimed run that isolated a teammate, or a sprint started too late/early relative to the play. I paired video with GPS timestamps to link events to speed data.
| Metric | Week 0 (avg) | Week 8 (avg) |
|---|---|---|
| Max sprint speed (km/h) | 29.2 | 30.1 |
| Number of sprints per match | 18 | 20 |
| High-speed distance (>19.8 km/h) (m) | 410 | 480 |
| Sprint-related errors per match | 5.0 | 3.0 |
Those numbers don't just look good — they framed our coaching. Not every player needed more top speed; a few needed better timing, others needed repeatability.
How we used the data in practical coaching
We changed three things: feedback loops, drill design, and recovery management.
Examples of drills we ran
Why numbers altered behaviour
Non-league players often want feedback but don't get it beyond "good job" or "work harder." The GPS gave them a personal scoreboard. When a player saw his sprint curve flatten in the second half, the accountability and the targeted drills made him invest in strength sessions and sleep. Small changes like reducing body fat or improving single-leg strength had visible improvements in 0–10m times.
Common questions I heard and how I answered them
Results that mattered
Beyond the table numbers, we found three practical outcomes:
At Samsophsaints Co we talk a lot about making sports science accessible and practical. This experiment was exactly that: low-cost tech, simple analysis, and targeted coaching. The GPS didn't replace coaching judgement — it sharpened it. If you run a grassroots or non-league club and you're asking whether a small investment in monitoring is worth it: my answer, from eight weeks on the pitch, is yes — if you use the data to ask better questions and to design better sessions.